Z-test

Alright, let's talk about the Z-test. You’ve just met the t-test, the handy lie detector for your data. But what if I told you there's an older, wiser cousin in the statistical family? One that’s a bit more demanding but incredibly powerful when it gets what it wants.
Meet the Z-test.
If the t-test is your go-to for most situations, the Z-test is the specialist you call in for a specific job. It answers the same big question: "Is this difference I'm seeing real, or just a fluke?" But it has one major requirement that sets it apart.
The Z-Test's Secret Weapon: Knowing the Lay of the Land
The core difference boils down to one thing: what you know beforehand.
Imagine you're a new coach trying to see if your team's average score is better than the league's.
The t-test is like going in blind you only have your team's data to work with. The Z-test, on the other hand, is like having the league's official playbook that tells you exactly how much scores typically vary from team to team (the population standard deviation).
That’s the Z-test's power. It’s used when we know the population's variance or standard deviation. This is a huge piece of intel about the entire group we're interested in!
In brief: The Z-test ensures the difference you see is big enough to be meaningful, not just random noise, by leveraging this known information about the whole population.
The Different Flavors of the Z-Test
Just like its t-test cousin, the Z-test comes in a few varieties for different situations.
1. The One-Sample Z-Test: The Benchmark Battle
When to use it: You have one group, and you want to compare its average to a known population average, and you know the population's standard deviation.
The Real-World Example: A national math exam has a known average score (mean) of 70 and a known standard deviation of 10. You're a principal and your school's 100 students averaged 72. A one-sample Z-test can tell you if your students genuinely outperformed the national average, or if that 2-point difference is just a lucky bounce.
2. The Two-Sample Z-Test: The Group Duel
When to use it: You have two separate groups, and you want to compare their averages, and you know the population standard deviation for both groups.
The Real-World Example: You want to compare two teaching methods. You have two groups of 50 students, each taught by a different method, and you know the historical standard deviation for test scores in the district. A two-sample Z-test checks if the difference in their average scores is significant.
3. The Z-Test for Proportions: The Vote Counter
When to use it: This one is a bit different—it's for comparing percentages or proportions.
The Real-World Example: A company claims that 60% of customers prefer their product. You survey 200 people and find that only 55% prefer it. A Z-test for proportions can tell you if this drop is a real shift in public opinion or just a sampling blip.
A Quick Reality Check: Let's be honest—knowing the true population standard deviation is pretty rare. This is exactly why the t-test is used way more often in practice. The Z-test often steps in as a solid approximation when your sample size is large (typically over 30), because your sample's standard deviation becomes a very good stand-in for the population's.
The Rules of the Game: Z-Test Assumptions
Before you run a Z-test, you’ve got to make sure your data plays by the rules:
The Big One: Known Population Variance. This is the non-negotiable. You must know the standard deviation of the entire population you're comparing to.
Normally Distributed Data: Your data should follow that familiar bell curve. But here's the good news: thanks to the Central Limit Theorem, this rule relaxes a lot for large sample sizes (n > 30). The bigger your sample, the less you have to worry.
Measurable Data: You're working with numbers on a meaningful scale (like test scores, weight, or time).
The Magic Formula (Don't Worry, It's Simple)
At its heart, the Z-test calculates a Z-statistic. Just like the t-test, it's all about Signal vs. Noise.
- Z = (The Signal) / (The Noise)
Let's break down the signals and noises:
One-Sample Z-Test:

Two-Sample Z-Test:
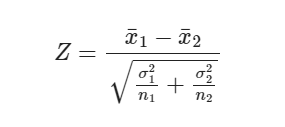
A large |Z| score (far from zero) means your signal is loud and clear compared to the noise. That's a great sign!
The Final Verdict: The P-Value Rule
You've got your Z-score. Now what? You look up the p-value.
Remember, the p-value is the probability of seeing your result if the Null Hypothesis (the idea that "nothing is happening") were true.
The rule is beautifully simple and identical to the t-test:
If p-value < 0.05: You reject the Null Hypothesis. You have strong evidence that the difference is real and statistically significant. Pop the confetti!
If p-value > 0.05: You fail to reject the Null Hypothesis. You don't have enough evidence to say the difference is real. It might just be chance.
The Quick and Dirty: T-Test vs. Z-Test
So, when do you use which? Here’s the cheat sheet:
Use the T-Test: When you're working in the dark, without the population's standard deviation. It's the pragmatic, everyday tool for comparing means. (The "I don't know the population SD" test)
Use the Z-Test: When you have the inside scoop—you know the population's standard deviation—or when you have a very large sample (n > 30) and can approximate it. (The "I know the population SD" test)
Think of the Z-test as the specialist you call when you have premium information. For everything else, the trusty t-test has your back. Now you're equipped to choose the right tool for the job
Found this guide helpful? 💕
I create clear, beginner-friendly data science resources to make your learning journey smoother:
📊 Explore my templates & planners: assiaboussanni.gumroad.com
🗨️ Join the conversation on X: x.com/BoussanniEl
☕ Support my work: ko-fi.com/assia81344


